The Sun
Overview
Our home star, the Sun, is located roughly 93 million miles (150 million km) away from Earth, a distance of about 8.3 light-minutes. Our star contains over 99% of the mass of the solar system, it provides the majority of the heat at Earth, and it is responsible for providing the energy that makes most life possible on our planet.
Despite its importance to us, our star is an average star as far as things go in the universe. Consequently, information about the sun's birth, fusion in stars, and the life cycles of stars can be found on those pages on this site.
Because of the sun's proximity, we can study it in detail that is simply impossible for other stars, and the bulk of this page is about the finer details of a sun-like star as revealed by studying our closest stellar neighbor.
How Energy Is Made
 |
| Graphic illustrating the three steps of the PPI Chain of hydrogen fusion and where energy is released. 3-D rendering of this graphic was created by Stuart Robbins. You can click on this image to see a bigger version. |
Stars like the sun primarily produce energy through the PPI process, which is pronounced "P-P One" because it is the main proton-proton fusion reaction. This is a three-step process even though it is the second step that produces the light that we see:
- Two protons (hydrogen atoms that have been stripped of their neutrons) combine to produce a hydrogen atom with one proton and one neutron, known as deuterium. Because neutrons weigh slightly less than a proton, two by-products that are released are a neutrino and positron (the anti-matter counterpart of an electron). The positron will combine with an electron and release some energy.
- A third proton combines with the hydrogen atom to produce a form of helium known as helium-3, which is two protons and one neutron. The by-product of this fusion step is a photon, which is the energy that we generally think of.
- Two helium-3 nuclei combine to form a helium-4 nucleus. Because what was combined were 4 protons and 2 neutrons, but helium-4 only has 2 protons and 2 neutrons, 2 protons are released as by-products from this step, free to fuse again. Most of the energy of this process is release in this step.
In chemistry notation, this chain is written as:
The net result of this is a release of 26.7 MeV of energy, where 1 eV is 1.6022·10-19 Joules. This may seem like a very tiny amount of energy, but keep in mind that about 2·1045 of these reactions take place every second in our sun. This is often referred to as "hydrogen burning."
For more about energy production in stars, see the "Fusion" page.
Composition
The solar composition closely reflects the composition of the universe, though it has been enriched with some heavier elements as a consequence of not being a first-generation star. These heavier elements are formed during normal fusion processes in stars (up through Iron) and in supernovae explosions in heavier stars.
 |
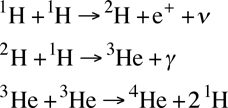
| A pie chart illustrating the compositional breakdown of the Sun's atmosphere. Data is from NASA's planetary factsheet. |
Because the sun is well over 99% of the mass of the solar system, the sun's composition is effectively the solar system's composition, as well. Individual objects, however, do vary from the solar composition, with some specific elements enriched relative to others (for example, even though silicon is a much smaller component of the sun than carbon, silicon is highly enriched in Earth's crust relative to carbon).
One of the primary methods for determining the composition of the sun is through spectroscopy.
 |
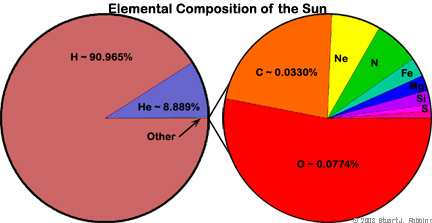
| Cross-section of the sun. |
Solar Structure
The sun is made of several layers which do not have distinct borders separating them. However, each layer has unique properties, and these are vital to how the sun works.
In the diagram to the left, the black circles show a separation between the layers.
The center of the sun, the Core, is the only part of the sun that actually produces energy through fusion. Models predict that the central temperature is approximately 15,710,000 K (28,800,000 °F). The central pressure is 2.477·1011 bars, and that the central density is approximately 1.622·105 kg/m3.
The next layer of the sun is the Radiative Zone, which is where most of the harmful gamma rays bounce around until they become less energetic forms of light. The temperature here is about 5,000,000 K (9,000,000 °F).
The layer that is next is called the Convection Zone, where solar material rises and falls due to heating and cooling, much like Earth's mantle, or like boiling a pot of water on a stove. The temperature here reaches only 5,800 K (10,000 °F).
The next section of the sun is called the Photosphere, which is actually what you see when you look at the sun. Earth's crust is like the sun's photosphere. The Photosphere is about 400 km (250 miles) deep. Sunspots occur on the photosphere. This is the place on the sun where the energy created can finally escape into space because the sun has reached a low enough density that it is now transparent. This portion of the sun reaches temperatures of 6,600 K (11,400 °F) at the bottom, and it dies down to 4,400 K (7,500 °F) at the top. The pressure at the top of the photosphere is approximately 0.868 mb.
The next layer is the lower part of the sun's atmosphere, the Chromosphere. It is only visible during a total solar eclipse, when the moon blocks the light from the Photosphere. It reaches temperatures of around 30,000 K (54,000 °F), and it is very thick at about 2500 km (1600 miles).
The last layer of the sun is called the Corona, and it is the upper layer of the sun's atmosphere. Like the Chromosphere, it is only visible during a total solar eclipse. This portion of the sun is about 1,700,000 K (3,000,000 °F).
Helioseismology: The sun oscillates like a gong: Patches of the surface of the sun oscillate up and down with a period of roughly 5 minutes (1/300 Hz). Discovered in 1962, these were poorly understood for almost a decade. They appear to be mostly a radial (inward and outward) motion of the surface. A network of satellites collectively called the GONG (Global Oscillation Network Group) monitor this seismic activity.
The source of these 5-minute oscillations found theoretical framework in 1970 and observational confirmation in 1975. The oscillations seen on the surface are due to sound waves that are generated and trapped inside of the sun, produced by pressure fluctuations in the convection zone. As the waves move outward, they reflect off the photosphere where the density and pressure decrease rapidly. Inward moving waves are refracted by the increase in the speed of sound as the temperature increases and eventually return to the surface.
The trapped sound waves set the sun vibrating in millions of different modes. Since sound is produced by pressure, the modes of vibration are called "p-modes" (just as earthquakes have pressure waves that are called p-waves).
The sound waves and the modes of vibration that are produced can be used to learn more about the interior of the sun in the same way that geologists use earthquakes to learn more about Earth's interior. Helioseismologists can use the properties of the waves to determine the temperature, density, composition, and motion of the interior of the sun. One recent discovery was that the different rotation rates between the equator and the poles is confined to the upper layers of the sun, and it disappears near the base of the convection zone.
Features on the Sun
Coronal Mass Ejections (CMEs): Coronal Mass Ejections (CMEs) are giant bubbles of gas whose structures are dictated by magnetic field lines that are ejected from the sun over the course of several hours. Even though the corona has been viewed for thousands of years via solar eclipses, CMEs were not known about until the space age. Observations of the sun made with a coronagraph - a device that blocks the sun's disk from a detector - on the 7th Orbiting Solar Observatory (OSO 7) between 1971-1973, were the first observational evidence of CMEs.
The reason that ground-based coronagraphs won't work is because only the innermost parts of the corona can be seen against the brightness of Earth's sky. Solar eclipses offer only a few minutes at best of the corona, which is too short of a time period to see the evolution of a CME.
CMEs disrupt the flow of the solar wind and can produce intense electromagnetic disturbances that can severely damage satellites and disrupt power grids on Earth. The frequency varies with the sunspot cycle; during solar minimum they are produced at a rate of about one per week, and during maximum there is an average of about two or three per day.
Filaments and Prominences: Filaments are dark, thread-like features that are seen in red light (H-α). They are dense, somewhat cooler, clouds of material. They are suspended above the surface of the sun by loops of magnetic fields. A prominence is the same as a filament, except that prominences are seen projecting over the limb of the sun.
Filaments and prominences can remain relatively quiet and stable for days or weeks, but as the magnetic fields that support them change, they tend to erupt and rise off the sun over the course of a few minutes to hours. These are thousand to millions of kilometers wide and tall.
Solar Flares: Solar flares are outbursts of solar material that are several thousand to million kilometers long. If we had some way of capturing all the energy emitted in one of the smallest solar flares, we would have enough energy to power the Earth for 1,000,000 years.
Spicules: Spicules are little-understood yet very common features of the photosphere. They appear as small, sharp, jet-like spikes of material, throughout the chromosphere. They tend to last only a few minutes, but in the process they eject material off into the corona at speeds of 20-30 km/s.
Sunspots: Sunspots are cooler areas of the sun's photosphere. They also have very strong magnetic fields, up to 10,000 times that of Earth's - up to 3000 times that of the rest of the sun - and current sunspot theory holds that it is the magnetic fields that cause sunspots. Sunspots usually occur in groups of approximately 10, and the individual spots can be as large as the planet Earth. They are usually about 5,000 K (8,500 °F), which is 800 K (1,500 °F) cooler than the rest of the photosphere (and why they appear black).
They were first discovered in ancient times. In 1610, Galileo Galilei became the first European to observe them. Daily observations began at the Zurich Observatory in 1749, and continuous observations between several observatories were started in 1849. They were not found to be caused by abnormal magnetic fields until 1908, by George Ellery Hale.
The "sunspot number" (SSN) is calculated by counting he number of sunspot groups, then the number of individual spots, and the SSN is given as the sum of the number of individual spots plus ten times the number of groups.
Sunspots have an eleven-year activity cycle that coincides with a 22-year pole complete magnetic pole flip of the sun*. When sunspots are at their peak, the sun becomes brighter - perhaps paradoxically considering that sunspots are dark. This is because magnetically brighter areas surround each sunspot, more than making up for the dimmer areas.
They peaked last in 2001, and had their last big dip around 2006-2008 during an extended minimum. The next peak is forecast to be between 2013 and 2014.
No one yet has a generally accepted theory as to why the sun has this "internal clock."
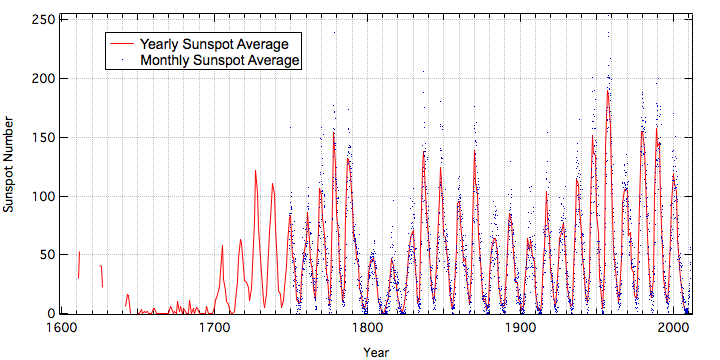 |
| Graph showing the yearly (red line) and monthly (blue dots) sunspot counts from 1600 through the present. Data is from NOAA's NGDC. |
The diagram above depicts sunspot records dating back over 400 years. The data displayed are through July 2011, for the monthly values, and through 2009 for the yearly average. It plainly shows that along with the eleven-year sunspot cycle, there appears to be a dramatic 70-year minimum where sunspot activity was nearly nonexistent. This period between 1645 and 1715 is known as the "Maunder Minimum," and it is sometimes referred to as the "Little Ice Age." During this period, rivers that were normally ice-free froze and snow fields remained year-round in lower altitudes.
Evidence of similar periods of solar inactivity are present in radioactive carbon-14 from 8000-year-old trees. There are also periods of increased activity, the last one occurring in the twelfth century (timely sunspot records do not exist that far back, so they are not displayed). These periods can last for over 200 years.
It was thought by some that we may have been entering a similar minimum in the first decade of the 21st century, but the return of sunspot counts above 50 by 2010 showed this was not the case, it was merely an extended minimum.
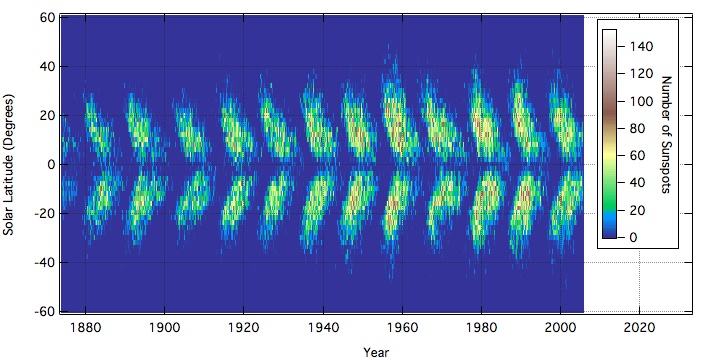 |
| Graph showing the latitude-density of sunspots from 1874 through 2005. |
Another interesting phenomena of sunspots is shown in the above graph, known as the "Butterfly Diagram." To create it, I used daily sunspot information for May 1874 (earlier data were not available) through September 2005, that contains data of the location of sunspots on the solar disk. I then binned this information into 3-month temporal bins and 2° latitude bins. The color indicates the number in each bin. The result depicts the intensity of sunspots on the sun throughout the sunspot cycles.
So, the sunspot lows are not only characterized by few spots, but also by sunspots concentrated near the equatorial regions. As the cycle approaches maximum, the spots jump closer to the poles, and then they gradually spread back to the equator as the cycle reaches another minimum.
Data
The following table lists data for the Sun. Data is compiled from NASA's planetary factsheet.
| Sun | |
|---|---|
| Orbital Inclination (from Earth's Orbit) | 7.25° |
| Average Radius (km) | 696,000 |
| Ellipticity | 0.00005 |
| Volume (1012 km3) | 1,412,000 |
| Mass (1024 kg) | 1,989,100 |
| Density (water=1 g/cm3) | 1408 |
| Surface Gravity at Equator (m/s2) | 274 |
| Rotation Rate at Equator (hours) | 609 |
| Rotation Rate at Poles (hours) | 936 |
| Polar Magnetic Field (Gauss) | 1 to 2 |
| Apparent Magnitude | -26.73 |
| Absolute Magnitude | +4.83 |
| Spectral Type | G2 V |
| Luminosity (1024 J/s) | 384.6 |
| Mass Conversion Rate (109 kg/s) | 4.3 |
| Average Energy Production (10-6 J/kg) | 193.7 |
| Surface Emission (106 J/(m2·s)) | 63.29 |
| Speed Relative to Nearby Stars (km/s) | 19.4 |