Spectroscopy
Overview
There is an old saying that goes, "A picture is worth a thousand words." For astronomers, if a picture is worth a thousand words, then a spectrum is worth a thousand pictures.
All a spectrum is is a spreading-out of the light from an object. These can be emitted directly from an object (such as a star), reflected off an object (such as the moon), or transmitted through an object (such as a star through a cloud of gas or through an atmosphere).
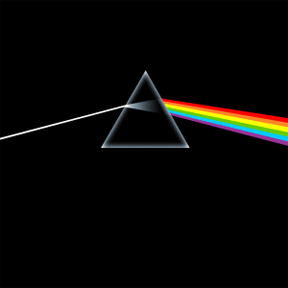 |
| This is the original album cover from Pink Floyd's "Dark Side of the Moon." |
One of the simplest ways to see a spectrum is by shining a light through a prism. Many early physicists did this, including Isaac Newton. The effect reached a new level of fame when Pink Floyd released their "Dark Side of the Moon" album, the cover of which is shown on the right. Because different wavelengths (colors) of light will slow down by different amounts, a prism acts to spread out the colors.
That is the field of spectroscopy - simply separating out light into its individual colors (where "color" includes all wavelengths, such as gamma-ray, x-ray, ultraviolet, visible, infrared, microwave, and radio).
What Is Color?
The last time I was at a hardware store, they had a paint section that had a seemingly endless supply of subtly different colors. From a "heart-throb red" to a "novel lilac," I think that the paint company must have employed someone to sit all day thinking up new adjectives to describe the latest color by mixing in one more part white to the ocean foam green. The reason I bring this up is that in our every-day lives, "color" is very subjective. What may be "red" to me is "pointsetta" to someone else, or "red obsession" to another.
Astronomers can't really do this. They can't say that one star is "resonant blue" while another is "jamaica bay" and a third is "danube." We need a way to quantify what "color" really is. To do that, we measure the amount of light emitted/reflected/transmitted through a filter that is one color and compare that to how much light is received through a filter of another color. This process is described below.
Broad-Band Filters
A "filter" is one area of astronomy where the vernacular use is similar to the scientific one. A filter is a device that screens out most colors of light and only allows a limited range to pass through. For example, if you look through a red stained glass window pane, that red glass is a red filter. It absorbs all wavelengths of light except red ones and so only lets the red ones get through to your eye.
The filters that astronomers use are usually more precise than a red stained glass window (and much more expensive as a consequence). They are engineered and tested to let only very precise ranges of light through. Because of this, astronomers use sets of standardized filters and when we quote colors, they always correspond to a specific filter set.
The most common is the Johnson system which consists of an ultraviolet (U), blue (B), "visible" (V, green), red (R), and infrared (I) filter set. These filters are used mainly because they are fairly wide-band, were created early on in astronomy, and hence nearly all of the early catalogs and data are in this filter system.
To derive a precise, quantifiable color, astronomers measure the amount of light through one filter and then the amount of light through another. They then subtract them. Usually the bluer color is subtracted from the redder color, such as B-V or B-R. In that manner, a negative number means the object is bluer, while a positive number indicates the object is redder.
Very coarse spectroscopy is done in this manner. When you approach the level where you are examining colors at the few Ångström level, "real" spectroscopy is taking place.
High-Resolution Color Analysis - Spectroscopy
"Real" spectroscopy is the high-resolution study of color - specifically looking at what wavelengths of light are emitted or absorbed by an object being studied. "Real" is placed in quotes because the actual definition of spectroscopy is more along the lines of the study of light when matter interacts with or emits light. This does not refer to a specific resolution, but I prefer to think of the above section on broad filters as not classical spectroscopy.
When one spreads the light from an object like the sun out into its component colors in such a way that they can resolve the different wavelengths at the level of perhaps 10s of Å or better, they can start to observe that it is not a smooth continuum of color. Rather, there will be some very narrow areas where the color is missing. These missing colors (called "lines") are caused by individual atoms or molecules absorbing them, removing them from the spectrum. This is called an absorption spectrum and is illustrated in the next section for hydrogen.
In a different case, say one looks at a sodium street light (those yellow lights that hurt your eyes and are usually found in parking lots) and spreads the light out from that. In this case, instead of a smooth spectrum of color with a few missing lines, there will be no background spectrum, but there will be a few very narrow lines of color, the brightest being in the yellow. This is an emission spectrum and is caused by a hot collection of one or more "excited" (energetic) atoms or molecules. An example of this is illustrated in the next section for hydrogen.
One of the primary utilities of spectra are they allow scientists to determine what objects are made of. We can conduct experiments and know exactly at what wavelengths of light different atoms and molecules will absorb or emit. We can then take spectra of an object, analyze what the wavelengths are that are missing (in the case of an absorption) or present (in the case of an emission) and then fit that to our known library of spectra.
This is how we know what Jupiter's atmosphere is made of. This is how we know what is coming out of Io's volcanoes. This is how we know what nebulae are made of. This is how we can tell what the ratio of elements is in a star in a distant galaxy. And in another use, this is how we can tell how quickly objects are moving towards or away from us (discussed below in the "Doppler Shift" section).
An Example: Hydrogen
Hydrogen is the most abundant element in the Universe. How do we know? Because everywhere we look, we see it. How do we see it? From its spectrum:
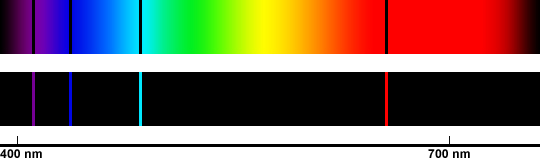 |
| This figure illustrates the visible spectrum of hydrogen. The top indicates an absorption spectrum because hydrogen has absorbed colors out of the background spectrum. The bottom indicates an emission spectrum because hydrogen is glowing to produce the colors. The four visible hydrogen lines are specifically at 410.2, 434.1, 486.1, and 656.3 nm (multiply by 10 to get Å). Figure created by Stuart Robbins. |
The above illustration is a classic hydrogen spectrum (both absorption and emission). These four visible-wavelength lines are also known as the Balmer Series. They are created when an electron moves from a third, fourth, fifth, or sixth energy state down to the second. The change in energy level when moving from a high to a low state releases a precise amount of energy that corresponds to the wavelengths of light shown above.
If one observes these precise four lines in a spectrum, then they can conclude that hydrogen is present.
Note that there are other hydrogen lines, but they are not visible to the human eye. Lines created when an electron goes from a high orbital to the third state are called the Paschen Series and are at infrared wavelengths. Lines created when an electron goes from a high orbital to the first (or "ground") state are called Lyman Series and are at ultraviolet wavelengths.
An Example: Doppler Shift
Redshift: Let's now say that you observe what you think is a hydrogen spectrum - you have the four lines that are spaced reasonably close to how they should be - but they occur at the wrong wavelengths. In the illustration below, they are 100 nm shifted towards the red end, or redshifted.
 |
| This figure illustrates the visible spectrum of hydrogen that has had the 656.3 nm line redshifted by 25 nm. Figure created by Stuart Robbins. |
This phenomena occurs when an object moves away from Earth (or an arbitrary observer). The velocity of the object can be determined by the equation
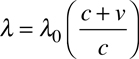
where λ is the observed wavelength of light, λ0 is the original wavelength, c is the speed of light, and v is the velocity of the object. In the above example, with the "red" line of hydrogen shifted by 25 nm, the object absorbing it would need to be moving away from us at approximately 11,430,000 meters per second (about 3.8% the speed of light).
You may also note that this shift is wavelength-dependent. While the 11,430 km/sec velocity shifts the red line by 25 nm, it only shifts the cyan line by 18.5 nm, the dark blue by 16.5 nm, and the violet by 15.6 nm.
This is why high-resolution spectroscopy is important - in order to detect velocities that are, say, 50 km/sec (like the most massive of the observed exoplanets), one needs to be able to measure spectra at the level of 0.1 Å or better (0.01 nm). Jupiter moves our star by just 13 m/s over a period of 12 years. In the 656.3 nm hydrogen line, this is a shift of only 0.00028 Å.
Blueshift: However, in detecting exoplanets, the shift can be multiplied by a factor of 2: When the planet causes the star to move away from us and its light is redshifted, half-way through its year, the planet will cause the star to now move towards us, causing its light to be blueshifted by the same amount.
A blueshift is caused by the same effect as the redshift, just the opposite - when an object moves towards us rather than away from us. In the equation above, the velocity would now be negative (since the distance is getting smaller) and so the observed wavelength is less.
Both Blue and Redshift: Now let's say you observe the following spectrum:
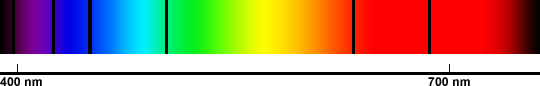 |
| This figure illustrates the visible spectrum of hydrogen that has had the 656.3 nm line redshifted AND blueshifted by 25 nm. Figure created by Stuart Robbins. |
This spectrum is still only hydrogen. However, the lines have been doubled - both red and blueshifted by the same amount. This is how we can tell that an object is rotating. The side of it that is moving towards us has its light blueshifted, while the parts of the object that is moving away from us is redshifted. The total light from the object will thus have all the lines doubled (at least) and we can discern its rotation rate. This is one way to measure how quickly other stars are spinning.
This is also one of the main ways to measure the rotation rates of galaxies. Since galaxies do not visibly rotate on the timescale of a human lifetime, we can effectively only use spectroscopy and the Doppler effect to determine how quickly they are rotating. In particular, spiral galaxy rotation rates were one of the early indicators of the existence of "dark matter" - material that seems to only interact gravitationally with luminous matter but not emit any observable light, nor cause other objects to change their light when they interact with it.