How to Measure Distances
Overview
In every-day life with nearby objects, determining the distance between two points is as easy as taking out a ruler or measuring tape. Objects farther away rely upon surveying techniques that, in modern times, use lasers. Humans have been to our nearest celestial neighbor, so if nothing else we effectively have an "odometer" reading on how far away the moon is, though its distance is more accurately determined by lasers, as well.
And that's it. There is nothing else in space to which we can directly measure the distance. From Venus to the nearest star to the Andromeda Galaxy and beyond, measuring distances relies upon proxy techniques that must be calibrated to other methods that are only good over a certain range. What this series of methods has come to be called is the "Distance Ladder" (sometimes "Astronomical Distance Ladder").
The purpose of this page is to describe the majority of methods used to determine distances outside of the solar system. The methods - and the distance ladder itself - are illustrated in the diagram below. This shows the techniques that work nearby to the ones that only work very far away, as well as how they overlap and are calibrated to each other.
Objects that can be used to do this are known as "standard candles" because there is a physical property that allows us to know how bright the object really is (its absolute magnitude). Once we know that, the distance to the object can be calculated because we know how bright it appears at Earth (its apparent magnitude). The conversion equation is known in astronomy as the Distance Modulus:
![]()
In the above equation, MA is the absolute magnitude, mV is the apparent magnitude, and d is the distance to the object in parsecs.
Note: Much of this page is based off of the Jacoby et al. (1992) reference.
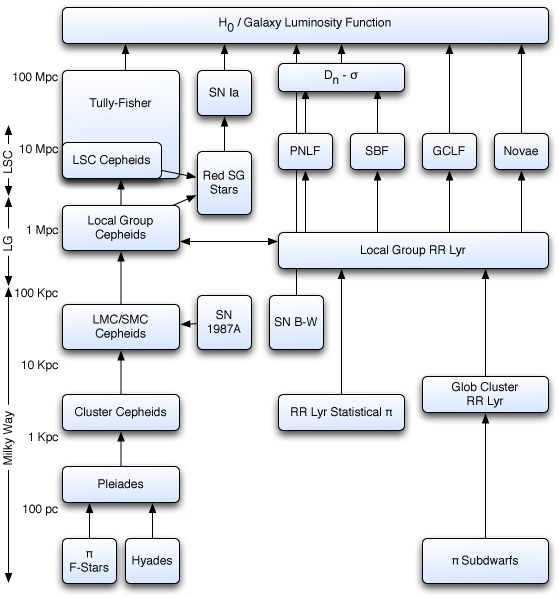 |
| This is a diagram showing the astronomical distance ladder for objects outside of the solar system. The scale on the left is in parsecs (pc) and is keyed to give a rough picture of how far these techniques go, either to the extent of the Milky Way, Local Group, or Local Super Cluster. It was originally published in Jacoby et al. (1992). It was adapted by Stuart Robbins in 2004 for this website. |
Parallax
Parallax is the only direct method that we have to determine distances to objects outside the solar system. It is sometimes abbreviated as π, as in the diagram above. The discovery of the first parallax is an interesting story and is related in short on the page, "Finding Parallax."
Parallax is defined as the apparent motion of an object relative to a distant, fixed background when the observer's position is moved. For example, close one eye and hold out your finger and line it up with a distant object. Then switch which eye is closed. Your finger, relative to the distant object, will appear to move because your two eyes are not in identical locations.
When astronomers measure parallax, they use the diameter of Earth's orbit around the sun as the "baseline" - effectively the distance between your two eyes in the above example. The closest star outside of our solar system, Proxima Centauri, is approximately 1.295 parsecs (4.3 light-years) away. At this distance, it only moves 0.0002145° over the course of 6 months in Earth's sky. Earth's moon is about 0.5°. Since a degree can be divided into 60 arcminutes (arcmin), and 1 arcmin can be divided into 60 arcseconds (arcsec), this corresponds to only 0.7723 arcsec -- a very small angle.
Because the angle is so small, determining the parallax of stars requires very high-precision measurements that need to be done by a satellite. Even then, with present technology it is difficult to determine distances beyond about 100 parsecs (300-400 light-years) before the uncertainties become larger than the measurements.
This was done by the Hipparcos satellite, which determined the parallaxes of nearly 118,000 stars. However, only about 5% of those stars had distances that were accurate to greater than 5%. Only about 25,000 were accurate to 10%.
Stellar parallax data is the first rung of the distance ladder. It is used to primarily determine distances to nearby open clusters such as the Hyades and Pleiades. Once the distance to the open clusters is known, that rung can be calibrated.
Open Clusters
Open clusters form the second rung on the distance ladder and they are used to bridge the gap between parallax and Cepheid variables. The key concept behind using open clusters is that the only variation in brightness and color (temperature) among stars in an open cluster is due to the different masses of the stars. All other effects - metallicity, age, distance - are not present.
Because of this feature, one can measure the color and brightness of all the stars in an open cluster and plot them on a Hertzsprung-Russell Diagram (also known as an HR Diagram or Color-Magnitude Diagram) where the color is on the horizontal axis and the brightness is on the vertical axis. Most stars will fall along a line through the center of the diagram known as the Main Sequence. The absolute magnitude of where this main sequence falls for a given color is the purpose of obtaining the parallax to open cluster stars.
Once we know how bright a star actually is when it is a certain color, then we can create an HR diagram that graphs the apparent magnitude of the stars along the vertical axis instead of the absolute magnitude. All one has to do then is take the Main Sequence line in apparent magnitude and shift it until it lines up with the main sequence on the absolute magnitude calibrator, and then one can calculate the distance with the distance modulus.
Cepheid Variables
The next step of the distance ladder are Cepheid variable stars. In short, Cepheids are stars that vary in brightness very regularly, and the time each variation cycle takes is directly linked to their absolute magnitude. Thus, by measuring the period of the cycle, astronomers know how bright the star really is, and they can then calculate how far away it is based upon how bright it appears at Earth. For more detailed information about these stars, please see the Variable Stars page.
Determining the distance to Cepheid variable stars through parallax is one of the primary goals of research on the astronomical distance ladder. They are especially important because Cepheids have a bright absolute magnitude because they are massive stars - hence they are also relatively young. Modern telescopes and detectors are able to observe them in the closest galaxies, making them useful for distance measurements from the closest Cepheid (around 500 pc) to the nearest galaxies (~10 Mpc). This allows the next few rungs of the distance ladder to be calibrated.
RR Lyrae Variables
Much like Cepheid variable stars, RR Lyrae variable stars pulsate with a period directly related to their absolute luminosity. These stars are red giants of similar or slightly less mass than the sun, and so they are generally much fainter than Cepheids. For more detailed information about these stars, please see the Variable Stars page.
Because of this, they are useful only out to globular clusters in our own galaxy, and they cannot be observed in other galaxies. Consequently, they are useful in calibrating the globular cluster luminosity function (discussed below) and provide a link between the parallax method and the globular clusters.
Type-Ia Supernovae
Beyond parallax and cepheids, type-Ia supernovae are probably the most important and versatile rung on the distance ladder. They generally include the fewest uncertainties themselves and have a very well-understood physical mechanism behind them.
Physically, type-Ia supernovae (SNe Ia) are explosive events that occur in a binary star system. One star is a dead, white dwarf, while the other star is still active. The two stars are close enough such that the white dwarf can pull material from the companion star onto its surface. When the white dwarf reaches 1.4 times the mass of the sun, the pressure of the atomic bonds holding the star together will not be enough, and the star will explode. (More information on the specifics of this is discussed on the White Dwarf Star page).
It releases so much energy that the absolute magnitude of these objects is around -20. This makes them visible out to, literally, billions of parsecs. Even though they are shown on the diagram above as being useful from ~50-100 Mpc, any that are visible can be used, from ones in neighboring galaxies (or our own) to ones that are up to half-way across the visible universe.
These are standard candles because it is relatively well-known and straight-forward physics that dictates exactly how much material needs to accumulate before the star can no longer support itself and collapses in an explosion that produces a neutron star. In addition, because they can be seen to such large distances, their calibration can be continuously calibrated based upon other rungs of the distance ladder (and vice-versa).
To use SNe 1a as a distance measurement, one must observe the brightness fade over a period of approximately one month (to estimate the peak luminosity). Ideally, one will observe the event actually happening and can start to monitor the brightness from that point on. Otherwise, the peak brightness will need to be extrapolated from when observations began.
With the apparent brightness of the maximum luminosity from the SNe Ia, then astronomers can calculate its distance by knowing what the true, absolute magnitude was.
Planetary Nebula Luminosity Function
Planetary nebulae are another standard candle, though one that has an empirical basis rather than one from known physics. One might think that planetary nebulae are faint from Earth - after all you need a telescope to see them - but "fresh" ones are fairly bright, and they are especially bright in the [O III] line at 5007 Å. Using a narrow-band filter centered at 5007 Å, one can still capture ~15-25% of the light from the nebula but dramatically reduce the light from surrounding stars, such as in a distant galaxy.
Planetary nebulae result when a dying sun-like star releases its outer layers, and the energy from the final collapse brightens them. (For more information about these, visit the Nebulae page.) They can reach an absolute magnitude as bright as about -4.5, which makes them visible out to the nearest large clusters of galaxies.
Their use as a standard candle is much the same as the globular cluster luminosity function, discussed below. It relies upon the idea that there is a standard distribution of the true brightnesses of planetary nebulae within a galaxy (since all the nebulae within that galaxy is effectively the same distance from Earth). The brightest ones will have an absolute magnitude of about -4.5, while most of them will be fainter. The distribution in brightness is an empirical exponential law.
To use this method, one needs to observe the galaxy in a narrow-band 5007 Å filter (since the exponential law is fit based upon those data). You then measure the apparent magnitude of the planetary nebulae that are visible. Bin the data by magnitude, creating a histogram, and then fit the histogram to the exponential. You then simply shift the exponential fit until it lines up with that from a known, absolute magnitude, distribution. Knowing the apparent brightness and absolute brightness then allows calculation of the distance.
Surface Brightness Fluctuations
Surface brightness fluctuations is a technique that works on dust-poor galaxies, such as ellipticals, S0, and the cores of spirals. The premise is that in any galaxy, you will have a distribution of stars that have different brightnesses. From Earth, we generally cannot resolve every single individual star, but rather each image element (pixel) will include several stars. Because there will be some pixels that have more bright stars than other pixels, we will see a variation (fluctuation) in the brightness of the different pixels that cover the galaxy.
If a galaxy is close by, we should see large differences from one pixel to the next because we will be able to better-resolve individual stars. Galaxies that are farther away will look smoother overall because each pixel will be the sum of all the stars within it. As the galaxy is farther away, it is more likely that you will statistically get an even number of faint and bright stars in each pixel, decreasing the fluctuation from one to the next.
And that is effectively this technique - simply measuring the amount of fluctuation in the brightness across the galaxy. This does have theoretical backing as it can be simulated from stellar population models, but in practice it is calibrated with nearby galaxies via lower rungs on the distance ladder.
Globular Cluster Luminosity Function
The globular cluster luminosity function is an empirical law that can be used to calculate the distances to galaxies as far away as ~50-100 Mpc. The function is generally more useful with elliptical galaxies rather than spirals, in part because giant elliptical galaxies can have thousands of satellite globular clusters around them, but spiral galaxies tend to have a few hundred or less.
Using this method relies upon the idea that there is a standard distribution of the true brightnesses of globular clusters, much like the planetary nebulae luminosity function discussed above. On average, globular clusters will have an absolute magnitude of approximately -7.4, with some being fainter and some being as bright as -11. Note that it is unknown why globular clusters have an average absolute magnitude of -7.4, and so a lack of a physical mechanism does lend some uncertainty to this method.
To use this technique requires measuring the brightness (apparent magnitude) of the globular cluster population of a galaxy. The number of globular clusters of a given brightness is binned into a histogram. The shape of the histogram follows a log-normal relationship and, if the galaxy is not too far away, one can see the peak of the histogram. Where it peaks is then assumed to be that standard absolute magnitude of approximately -7.4 (Harris, 2001).
The bulk of the uncertainty in this method relies upon calibrating that turn-over or peak luminosity point via the lower rungs of the distance ladder.
Tully-Fisher Relationship
The Tully-Fisher (TF) Relationship is an empirical observational relationship between the luminosity of a spiral or irregular galaxy and its rotational velocity. It was used back in 1922 by Öpik to estimate the distance to M31, but the technique did not gain traction until Tully and Fisher published their paper in 1977 advocating its use.
The technique relies upon first knowing the distance to numerous nearby spiral and irregular galaxies to act as a calibration (so we know their absolute magnitude). One must them measure the rotation rate of the galaxy, which can be done spectroscopically by measuring the red and blue shift of emission lines (generally H I at 21 cm is used). Measuring the red and blue shifts reveals the line-of-sight velocity of the stars and hence their speeds around the galaxy.
Once the technique is calibrated appropriately, the apparent magnitude of distant galaxies can be measured along with the rotation rates. Based on the rotation rate, the absolute magnitude is determined, and from that, the distance can be calculated.
Novae
Novae are stars that suddenly brighten and then decrease steadily in brightness until they are no longer visible. The maximum brightness they reach is around -10, making them useful for extragalactic distance measurements. The "standard candle" attribute about them is much like the type-Ia supernovae in that the rate of decline in brightness is an indicator of how bright the nova really was.
Calibration of novae is generally done for the few ones visible in our own galaxy as well as those in the nearest large spiral, M31. It can be calibrated with galaxies that are farther away, but using the "lowest rungs" of the distance ladder are preferable so that uncertainties do not build up as much.
Dn-σ Relation for Elliptical Galaxies
This technique is also known as the "Fundamental Plane," and it is another empirical standard candle. Just as rotation curves only work for spiral and irregular galaxies, the fundamental plane is a relation that only works for elliptical galaxies. There is some basic physical understanding of the relation based upon the Faber-Jackson relation L∝σ4 (relating the overall luminosity with the velocity dispersion).
In this relation, the Dn parameter includes both the luminosity and surface brightness of a galaxy. The σ parameter is the amount of variation in velocities of stars in the galaxy (velocity dispersion) which is measurable from spectroscopic observations of red and blue shifts. To use this method, one measures both and then uses calibration from lower rungs to derive the absolute magnitude.
Hubble Constant
At very large distances, the expansion rate of the universe overrides any gravitational attraction, and the Hubble Constant can be used to determine the distance to objects. This relies upon only measuring a galaxy's redshift to determine its velocity away from us and then knowing what the Hubble Constant, H0, actually is.
Current estimates of H0 are approximately 75 km/sec/Mpc (75 kilometers per second per mega-parsec). This means that if objects were moving away from us only due to the expansion of the universe, then an object 1 Mpc away would move away from us at 75 km/sec. An object 2 Mpc away would move away from us at 150 km/sec. An object 1 Gpc away would be moving away from us at 75,000 km/sec.
The primary uncertainty in this method is in the value of H0, and whether it has remained constant throughout time.